Monday 30 May 2011

Market Vectors Vietnam - ETF

Market Vectors Vietnam - ETF
As you can see after a bear run in 2010, things looked like it is picking up for the Vietnamese market in December 2010. Money is pouring into the markets, foreign investors are coming back in and it looks as though Vietnam is on course for a recovery and a major bull market is imminent.

However as you can see there was a short signal in January and then a long signal not long after in the same month! It seems the investors or " big players" are confused... should they go in or stay out? Alas a short signal was triggered by the COT Proxy. This tells us that the investors and "big players" are moving out and fast! The downtrend has started and up till now the market is making new lows. With this info, will you be going into the Vietnamese market now and try to catch a falling knife?

Do take note that Vietnam is an emerging country and there are many opportunity awaits. We will wait until we have a clear bull signal before we re-enter. If you trade individual stocks in Vietnam (Ho Chi Minh Stock Exchange, HOSE), do take note of the index/ETF to give you a broader picture of how well the market is doing.

Commitments of Traders Report (COT) Proxy of South-East Asian Countries

Ever wonder which country's economy is in an uptrend or downtrend? Want to know if investors are putting in hot money or pulling them out of the country? If you have this information, you can better allocate your capital especially if you hold stocks in various countries. You follow what the "big investors" do and try to reap in the rewards. In this series we will look at the market performance of the South-East Asian countries. We start off with Vietnam.
Vietnam's economy is one of the underperformers in South-East Asia, while the rest (Singapore, Malaysia) are experiencing somewhat of a bull run. Vietnam has lagged quite a bit.

How can you play Vietnam's stock market?
1) For foreign private investors you will have to fly into Vietnam and open a local brokerage account pending approval.
2) or play the Market Vectors Vietnam ETF.

We will look at the 2nd option which is accessible to all!

Samko - SGX

Samko

Already had a run-up since Mar 2011... those who want to enter now will have to be aware of this however you be comforted to know that the "big players" are still long on this counter. Anything from 0.18 to 0.24 is a good price to enter, recommended stop will be tight at 0.17

SATS - SGX

SATS - COT Proxy
Got stopped out after the COT Proxy level hit selling territory on daily charts (bought in at 2.67). Looking now for the buy signal to re-enter. Strong upward trend expected if price hit 2.70, will re-enter at this price. If this fails, price might be going down further.

Sell in May & Walk Away... Buy in July & Watch it Fly

What a month May has been. With the commodities sell-off and some stocks making a push down, it seems like the old adage of "Sell in May & Walk Away" still rings true.

Looking at the prices this morning on the SGX, a lot of green numbers are flashing across the board. So is this the signal for the "Buy in July & Watch it Fly" trade to come in (although we are only approaching June)?

Have a happy Monday and we will start off looking at the stocks for this week!

Friday 27 May 2011

Commitments of Traders Report (COT Proxy) - Larry Williams

For those of you not familiar with the Commitments of Traders Report, COT Proxy, you might want to check out this website Larry Williams Picture Perfect Trading for a brief introduction. I attended one of his Picture Perfect courses a few years ago and this was one of the things he touched on. The COT report is released by the US Commodity Futures Trading Commission where they show the open positions of traders for futures contracts. For stocks and other instruments there is no such COT report released so what the proxy has done is to simulate/gauge the open positions of these traders.

Wednesday 25 May 2011

CapitaMall - SGX

CapitaMall
One of few stocks that just signalled a buy this week @ 1.91. There is time to get into this long trade as the train has not left the station!

Tuesday 24 May 2011

Genting - SGX

Genting
Exit trade after being stopped at 2.09. Those who want to enter long, be aware the proxy is turning to bearish level. Better saty out of long trade for now.

Singapore Technologies Engineering Ltd - SGX

 
Singapore Technologies Engineering Ltd - COT Proxy
A defensive stock that mom and pops like to have. But is it a good time to load up on the stock? Starting of a downtrend...

Cosco Corp Daily - SGX

Those of you requesting for the Cosco Daily chart for shorter trading time frame, please see below. The "Commercials" are still shorting the stock. I advice not to enter the long trade for now until the buying signal is triggered. Please note that for this I am using the overbought/sold level instead of the divergence model as this is a shorter time frame on 18 daily period. You can choose either one, it is up to you to see which one you suits you best.

Cosco Corp

Sime Darby - KLSE

For those trading counters in Malaysia KLSE, here is a chart of Sime Darby for you. Uptrend started since Oct 2010 and still going strong!

Sime Darby - KLSE

Cosco Corp - SGX

Cosco Corp
Quite a sell-off in some counters because of Euro debt problems. Time to sell off? Cosco is reaching the short signal, we will need to see the final signal this Friday for the confirmation as the COT Proxy is set on weekly period.

Straits Times Index ETF - SGX

Straits Times Index  ETF
Where is the STI heading? COT Proxy is show bearish signal however price was pulling up and stuck in rangebound a few weeks now. Is this a false bullish movement?

Saturday 21 May 2011

SIA - SGX

People call this a jackfruit stock waiting to drop? COT Proxy signal a short since Jan 2011. Although it has bounced off its low of 12.8+, only time will tell if the bounce can sustain itself, meantime it is still in the "commercials/speculators" selling territory. Don't enter long if you don't have to :)

SIA - SGX

Semb Marine - SGX

Semb Marine - COT Proxy


Semb Marine has been having a run up since May 2009. Seems like it is running out of steam since its recent peak. The COT Proxy is approaching the convergence point. Those who dare can enter a long trade here although the provision for stop-loss will be bigger. Those with smaller risk appetite can wait and see what the next few weeks bring in until we see a clearer trend developing.

Friday 20 May 2011

DMX Tech - SGX

Rangebound since early last year and downtrend started since Feb 2011.

DMX Tech


Baker Technology - SGX

Baker Tech
Baker Tech is in a downtrend now as marked by the COT Proxy. Don't be fooled by the apparent breakout in price. As you can see the proxy does not signal a buy! It is a false breakout.

Noble Group - SGX

Stop-Loss Triggered!

Noble Group
Ignore the gap, that was the bonus issue given out.

Ezion Holdings Company - SGX

Ok another shipping company... looks like we got to stay clear of this counter as well.

Ezion Holdings Company
This counter has been ranging for quite some time now. Now the sell signal has been triggered. It has been triggering trades and stopping it but the stop-loss of the COT Proxy is very tight and we are still profitable because of the huge bull run. Keep losses small and let winners run. Doesn't matter if you have may small losses as long as the winners take care fo them!

Neptune Orient Lines - NOL - SGX

NOL
This a chart I posted at Punters Gallery Forum:
http://www.puntersgallery.com/showthread.php?p=349295&posted=1#post349295

This is a chart for NOL - Neptune Orient Lines. Look at the trade that was triggered. From the boom period of 2007 to the crash of 2008 and bull period again of 2009. The COT Proxy tells us when to exit and stay on the sidelines and when to safely enter the market again. If you are into shorting, you short the counter during the downtrend of 2008 and the COT Proxy will tell you exactly when. Currently it tells us to short the market or stay out of the trade completely if you are only into longs.

I will like to reinforce again do take note that I am still learning and also this is not the mother of all indicator/strategy/system. Exhaustive testing has not been completed and it never will be... There is no all 100% successful trade. What is important losses are kept small and winners are big to more than cover the losses even if win % is small and that is what the COT proxy offers. Traders should make their own decision and not allow anyone to decide for them.

The COT Proxy give tight stop-loss signal which minimise lost amount, it let winners run and all of these combined give you the confidence to enter/exit the trades. This is one important aspect that every trader/investor must look at.

Thursday 19 May 2011

COT Proxy for Stocks

Now that we have seen the power of the COT Proxy, we will apply it in instruments such as stocks. We will look into SGX stocks in particular and how we can use the Proxy to make better decisions in trading/investing! Look out for the next post!

Wednesday 18 May 2011

US Dollar Index COT Report vs COT Proxy

Let us see the charts for GBP/USD! We will calculate the COT Proxy for the US Dollar Index. Similar isn't it and the COT Proxy provides a more refined signal! The commercials are in green and speculators in red.

US Dollar Index COT Report vs COT Proxy

Euro FX COT Report vs COT Proxy

Euro FX COT Report vs COT Proxy
Look at that! The EUR/USD chart with the Euro FX COT Report in the middle chart and the COT Proxy chart in the last row. The COT Proxy match the COT Report! (The commercials for Euro FX are in green and speculators in red). And the best thing is it gave earlier signals and smoother chart than the real COT Report! We can trade it straight off the Proxy instead of the real COT! We will look at some more charts before we apply it for stocks in SGX!

COT Proxy!

Now what do we do about other instruments that do not have the Commitments of Traders Report released like stocks, ETFs, etc? We can create our very own proxy! With this proxy you can see what the "commercials and speculators" are doing for stocks, ETFs and CFDs. I got to know about COT proxy when I attended Larry Williams trading course in Australia many years ago. Immediately saw the power of using it for trading any instruments without the real COT report.

Now the question comes, how can we be certain the COT Proxy works exactly or closely as the real COT Report? To test this we have to compare it from the real COT to the COT Proxy in a side by side comparison. The move must be in unison. Let's see it in the next post!

Euro FX - Commitments of Traders Chart

For those who trade Forex, you will find the COT useful too! Look at the Euro FX COT charts.
Euro FX - Commitments of Traders Chart
The speculators are buying in. Let us see the COT charts being put into Metatrader (I know that most of you trading Forex is using Metatrader) for a clearer picture with the chart for EUR/USD.

EUR/USD with Euro FX COT Charts
The commercials are in green and speculators in red.

You can see that on 23 Jan 2011, there is a convergence of the commercials and speculators. The speculators started to go long and see where the price is heading until now (May 2011). I have gone long since Jan 2011 and my position is still open, unrealised pip profit is at +644.

Silver - Commitments of Traders Chart

Want to know where silver is heading?

Silver - Commitments of Traders Chart
The speculators have been long since 1999! For gold, you have the Gold ETF to trade. If you want to look into investing/trade into silver, you can also look into silver proxies such as silver miners/producers, etc.

More Charts

I will show more COT charts, it is simple trading, just follow what the traders do and look out for the convergence between the commercials and speculators. I am also excited to show the COT Proxy that I have done for stocks in the Singapore Stock Exchange (SGX). In the meantime, just google around and find out more about the Commitment of Traders Report so that you understand better!

Copper - Commitments of Traders Chart

We shall look at metals, here we have the Copper Commitments of Traders Chart.

Copper - Commitments of Traders Chart

The COT chart shows that the bottom for copper is on Mar 2009 and the traders start buying into Copper. Lets look at the London Metals Exchange chart for the prices.

Copper - London Metal Exchange Chart
You can see that the prices bottom at around the same time and rises up as more and more traders enter long!

Power of COT Report and COT Proxy

You can see one of the powerful potentials of the Commitments of Traders (COT) report. It tells us the real story behind every movement. Now what about stocks? The COT report is only released for future contracts. For stocks there is no reporting system other than what the insiders (substantial shareholders, directors, managers) have to report to the exchange for the trades they make.

What if we can create some sort of a proxy COT Report for stocks? Yes we can!

But before I go through that, let us see some more COT charts for the other futures instruments.

Gold - Commitments of Traders Chart

The graph below shows the relationship between the commercials and the large speculators. They go the opposite don't they? When the commercials are long, the speculators are short and vice versa.

Gold - Commitments of Traders Chart

The commercials (producers) are producing and selling (short) and the speculators are buying (long) since 2002! Look where the price of gold is now. Even though the price has fallen in the last few weeks, the percentage remains the same. From here you can expect the price of gold to go higher! The sell-off is nothing but consolidation! People have been saying to sell gold now but that is not what the Commitments of Traders chart is telling us. It tells us to buy, buy, buy!

On a side note, if you don't know how to invest in gold and don't want to hold onto physical gold, you can look at the SPDR Gold ETF. In Singapore, it is traded like a stock on the Singapore Stock Exchange (SGX).

Understanding the Commitment of Traders Report (COT) - Part 3

How do you make sense of it all, with all the numbers?


COT Report Exported to MS Access

To make it easy for me to interpret the data, I exported the raw COT report into MS Access which allows for easy filing, retrieval and manipulation. Please see the screenshot above for what I have done. It is easy to sort by year, by the commodity, by the exchanges, etc. It is also advisable that you know basic SQL language so that you can play around with the data.

Understanding the Commitment of Traders Report (COT) - Part 2

The raw data of the COT Report can be confusing. It is better to focus only on data that is relevant to your pursuit. For me, I focus on the marked red lines.

COT Report
I look at the long/short numbers for the 3 types of traders: commercials, non-commercials and non-reportables. By comparing the numbers with previous weeks numbers you are able to tell the trend of each trader class.

Understanding the Commitment of Traders Report (COT) - Part 1

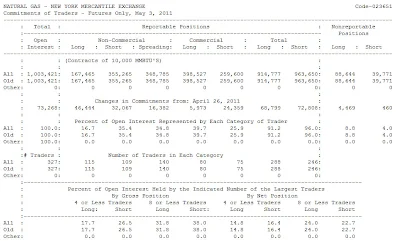
Natural Gas - NYME COT Report


The report above is downloadable at the US Commodity Futures Trading Commission http://www.cftc.gov. Please take note that this is the Legacy COT report (Long Format). Historical reports can also be downloaded. It runs as far back as 1999. The files are compressed. Please see the screenshot below. The format is confusing isn't it?

Historical COT Report - Easy for Data Mining and Manipulation

Sunday 15 May 2011

Commitments of Traders Report (COT)

The report is released by the US Commodity Futures Trading Commission (CFTC) every Friday. All open US futures positions on Tuesdays are collated and tabulated for the report. As you can see there is a 3 day gap between tabulation and release. The report also contains corresponding options. 

The report will show the open positions of 2 categories:
1) Reportable
2) Non-Reportable

The Reportable are divided into 2 types of traders:
1) Commercials (eg. Producers of crops, large buyers of cocoa like Hershey who use it for their business, etc)
2) Non-Commercials aka Large Speculators (eg. Hedge funds, trading houses, etc)

The Non-Reportables are usually small speculators/traders.

CFTC has since released a different set of report format. The above which I have explained is now called the Legacy COT report. The new one is called the Disaggregated Commitments of Traders Report. I will go through the new format in later posts. I will go through the Legacy COT report in later posts so that you can understand the difference between the two.

In the next post, I will show you next on how the reports are formatted and how to read and understand the main numbers.

The Holy Grail of Trading


What is the Holy Grail of Trading? A system or methodology that you can trade without incurring any losses and getting maximised profits. Is there such a system? I don’t know if it exists, maybe they do but I know of something that comes close. How do you like to know what the big traders are doing? Since these traders can potentially move the markets, do you not want to follow them? It is like trading with the insiders isn’t it?

Are they going long or short this week? If they are long, what is the size of the trade? Have they been long only this week or have they been long for the past few weeks? Is there a trend that they are following?

The Commitment of Traders Report or COT for short will tell us exactly that! I will explain more about the COT report in the next post.

Wednesday 11 May 2011

No Trade Keppel Land (K17 - SGX)

Keppel Land K17
Price in a down-trend, it started falling after dividends was out. Waiting for an opportunity to go long. One of the better trending stocks for 2010

Long F&N (F99 - SGX) 6.28

F&N - Long on 10th May 2011

Long at 6.28. I use SMA 200 to see general trend and use this as one of the factors for entry. Exact entry is determined by the individual. Some people add in their own additional conditions be it technical or fundamental before entering. Entering at the right time is important. Entering too early might create a whipsaw, entering too late the price would have move a lot. Stop-loss is determined by the same method.

Hello World!

Haha this is my first post... testing 123... 123 :D